

After a fueled momentum since Q4 2020, the stock market has experienced seesaw dynamics since late Q3 2021. The latest Q3 2021 stock market pefomance figures reminded of the increasing market volatility and other dynamics in late Q1 and early Q2, 2021. Major questions coming from AroniSmartIntelligence™ users have recently focused on how to use AroniSmartIntelligence capabilities to analyse the connection among the key Stock market indices, especially NASDAQ vs Dow Jones(DJI), S&P 500, and Russell 2000. AroniSmart™ team, leveraging the Machine Learning Time Series capabilities, including Support Vector Machine, and Neural Network Analysis of AroniSmartIntelligence™ , has analyzed the trends of NASDAQ vs the other stock indices (DJI, S&P 500, Russell 2000) between Q4 2020 and Q4 2021 and came up with insights and projections on the dynamics. The insights are presented below (for disclaimer and terms, check AroniSoft website. For related analyses of Stock Markets using Time Series, Dominance Analysis, and Neural Network capabilities see here AroniSmartIntelligence™ in Action: Apple (AAPL) Stock Performance and Momentum Analysis with Support Vector Machine and Dominance Analysis in Q3 2021) ( For More on AroniSoft LLC and AroniSmart products click here).
The analysis produced the different measures of forecasting accuracy, including directional accuracy of Stock market indices. Directional accuracy is an important statistic when ones tries to look at the prediction of a given stock market indice vs others, for example, as in this case, the NASDAQ Adjusted Closing Price as a function of Open, Low, High, and Closing Prices and volume of other market indices.
A little bit of the usual investment research before coming back to AroniSmart™'s findings.
Indices Momentum
In general all indices have experienced an upward momentum since Q4 2020: Dow Jones (.DJI) has grown by 19.62% to 34,496.06; S&P 500 (.INX) by 23.40% to 4,361.19; Nasdaq Composite (.IXIC) by 21.98% to 14,486.20; Russell 2000 Index (RUT) by 34.66% to 2,220.64. However the dynamics in the last 6 months (mid Q2- early Q4) are mixed: Dow Jones (.DJI) has increased by 2.22%; S&P 500 (.INX) increased by 5.65%; Nasdaq Composite (.IXIC) increased by 4.59%; Russell 2000 Index (RUT) decreased by 0.59%.
Similar Trends with Differential Nuances.
AroniSmart™ team analyzed stock indices performance dynamics, leveraging the Econometrics and Time Series Support Vector Machine and Neural Network Multilayer Perceptron capabilities of AroniSmartIntelligence™ and uncovered interesting insights, as shown below. The team analyzed the performance of NASDAQ Adjusted Close vs Open prices of the other indices (DJI, S&P 500, Russell 2000) , and each indice's Adjusted Close vs other indices prices (open, low, high, adjusted close) and volume, from October 12, 2020 to October 11, 2021.
From the analysis, it was found that these indices basically follow similar trends. Also, they are all similarly impacted by the market conditions. However, the analysis found important nuances.
The key findings highlight: the indices studied had an upward momentum over the period. However, like the general stock market, they faced a slowdown and high volatility in late Q1-Q2 2021 before starting a bounce back, then going on a seesaw movement. Trendwise, since June 2021, the stocks have been on fueled momentum reaching high or record price levels. The upward momentum accelerated in Januay, June, July and August 2021. Then in September and October, 2021, the dynamics pointed to a slow down, downward trends, seesaw movements, and probably a potential correction.
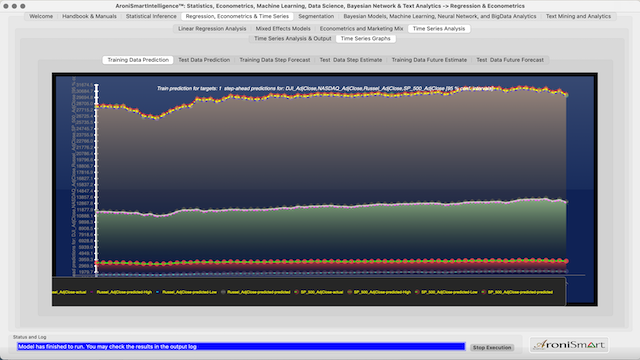
Figure 1: Key Indice Price Trends in Q2-Q3 2021 -- Training Data model.
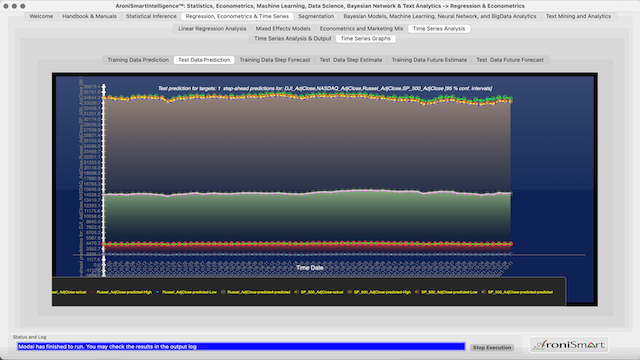
Figure 2: Key Stocks Indice Trends in Q2-Q3 2021 -- Test Data model.
Over 2021 all the stocks indices built on an earlier momentum, almost following similar trends.
By July of 2021 most indices were above the average Q1 2021 levels. In early Q2 2021, all indices momentums were significantly impacted by the market conditions. In late May 2021, they bounced back and maintained momentum until late September 2021 (see charts below). Since then, the indices have been experiencing seesaw dynamics. As expected, the indices do not exactly follow the same trends and projections, neither in training nor in test data (see DJI and NASDAQ examples below).
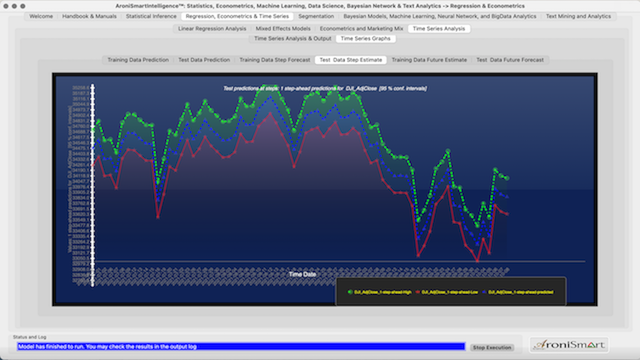
Figure 3: Dow Jones (DJI) Step Estimate July 2021 - October 2021
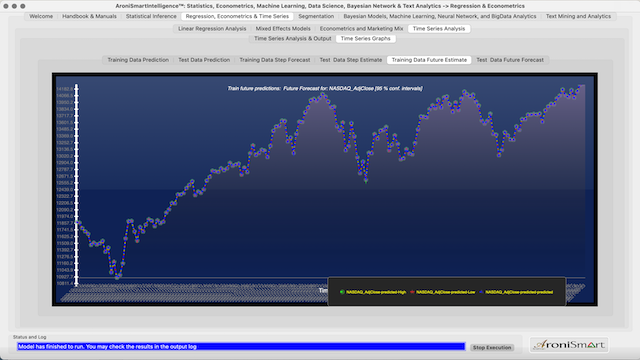
Figure 4: NASDAQ Index Trends and AroniSmart Projections Analysis Between October 2020 and June 2021
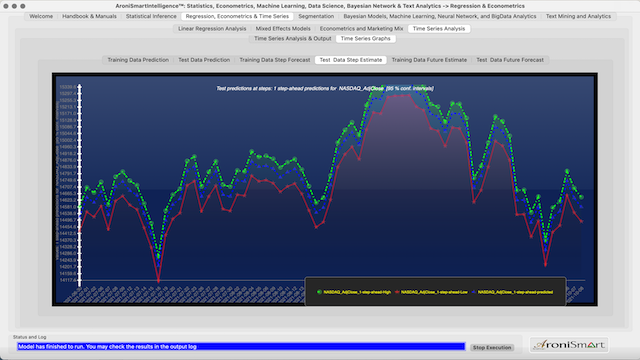
Figure 5: NASDAQ Stock Market Index Trends and AroniSmart Projections Analysis Between July 2021 and October 2021
AroniSmartIntelligence™ modelling shows the stock indicesthat appear to mirror each other: a high opening for the stock market indices that tends to lead a decline or slow down in NASDAQ's adjusted closing price and a high opening for the stock market indices that tends to lead an increase or growth in NASDAQ's adjusted closing price. Late Q4 2020 - Early Q1 2020 and late Q2- early Q3 dynamics appear to positively impact NASDAQ Index, whereas the end of Q3-early Q4 2021 appears to have been challenging.
AroniSmartIntelligence™ analysis, using Time Series Support Vector Machine modelling and Neural Network Multilayer Perceptron , below shows the weights of the different indices and the forecast statistics. From the statistics, directionay accuacy is in general high, pointing to an overall simila dynamics across all maket indices.
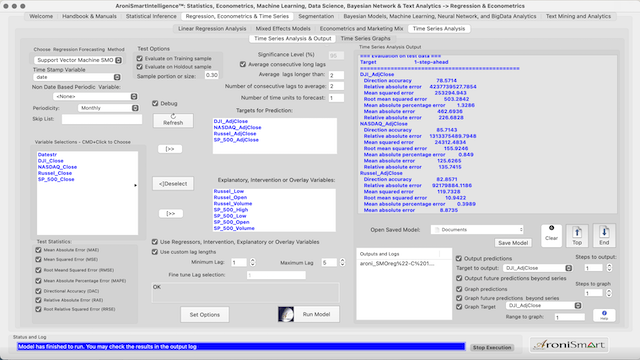
Figure 6 - a: NASDAQ Stock Index Dynamics and Statistics - AroniSmart Support Vector Machine Analysis Results for the Period Between October 2020 and October 2021: Statistics
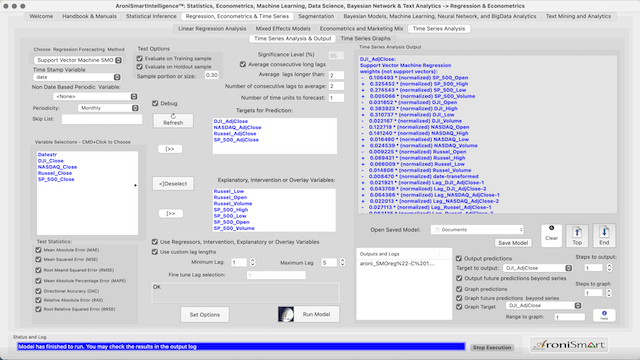
Figure 6 - b: Stock Index Dynamics and Statistics - AroniSmart Support Vector Machine Analysis Results for the Period Between October 2020 and October 2021: Weights - DJI example.
AroniSmartLytics™ Neural Network Analysis confirms Time Series Support Vector Machine results: NASDAQ momentum negatively impacted in late Q1 2021 - early Q2 2021 and late Q3 2021 and generally aligned with the momentum of most of other stock market indices.
AroniSmart™ team analyzed NASDAQ's performance dynamics using Neural Network Analysis capabilities of AroniSmartIntelligence™ and uncovered insights confirming the performance dynamics of NASDAQ vs other market indices from October 2020 to October 2021. See below:
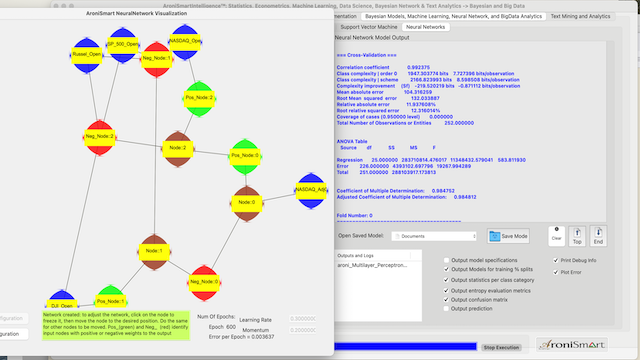
Figure 6-a: NASDAQ Stock Index Dynamics - AroniSmart Neural Network Analysis Results for the Period Between October 2020 and October 2021

Figure 6-b: NASDAQ Stock Index Dynamics - AroniSmart Neural Network Analysis Results - Model setup and network for the Period Between October 2020 and October 2021
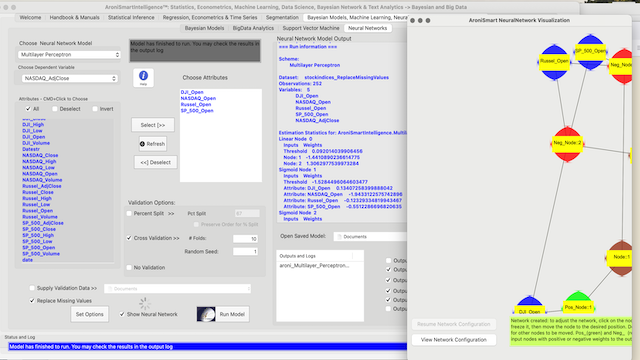
Figure 6-c: NASDAQ Stock Index Dynamics - AroniSmart Neural Network Analysis Results - Weights for the Period Between October 2020 and October 2021
More detailed analyses can be conducted using AroniSmartIntelligence™ Big Data, Machine Learning, Time Series, Neural Network and Sentiment Analysis capabilities.
For more on AroniSmartIntelligence and AroniSmartInvest capabilities, visit AroniSoft web site by clicking here. AroniSmartInvest™ and AroniSmartIntelligence ™ are available on Apple's App Store.
Advertisement
GET ARONISMARTINTELLIGENCE™ on App Store


AroniSmartIntelligence™, the leading tool for Advanced Analytics, Machine Learning & Data Science
Statisticians, Data Scientists, Business and Financial Analysts, Savvy Investors, Engineers, Researchers, Students, Teachers, Economists, Political Analysts, and most of the practitioners use Advanced Analytics to answer questions, to support informed decision making or to learn.
AroniSmartIntelligence™ is a leading Advanced Analytics, Machine Learning and Data Science tool, with optimized cutting edge Statistics models, Econometrics, Big Data and Text Analytics.
AronismartIntelligence™ includes modules covering Machine Learning and Big Data mining, Unstructured Text Analysis, Sentiment and Emotion Analytics, Bayesian Statistics and other advanced analytics.
@2021 AroniSoft LLC
For More on AroniSoft LLC andAroniSmart products click here